The SPACES Model Explained: Proving Your Community's Value
TL;DR:
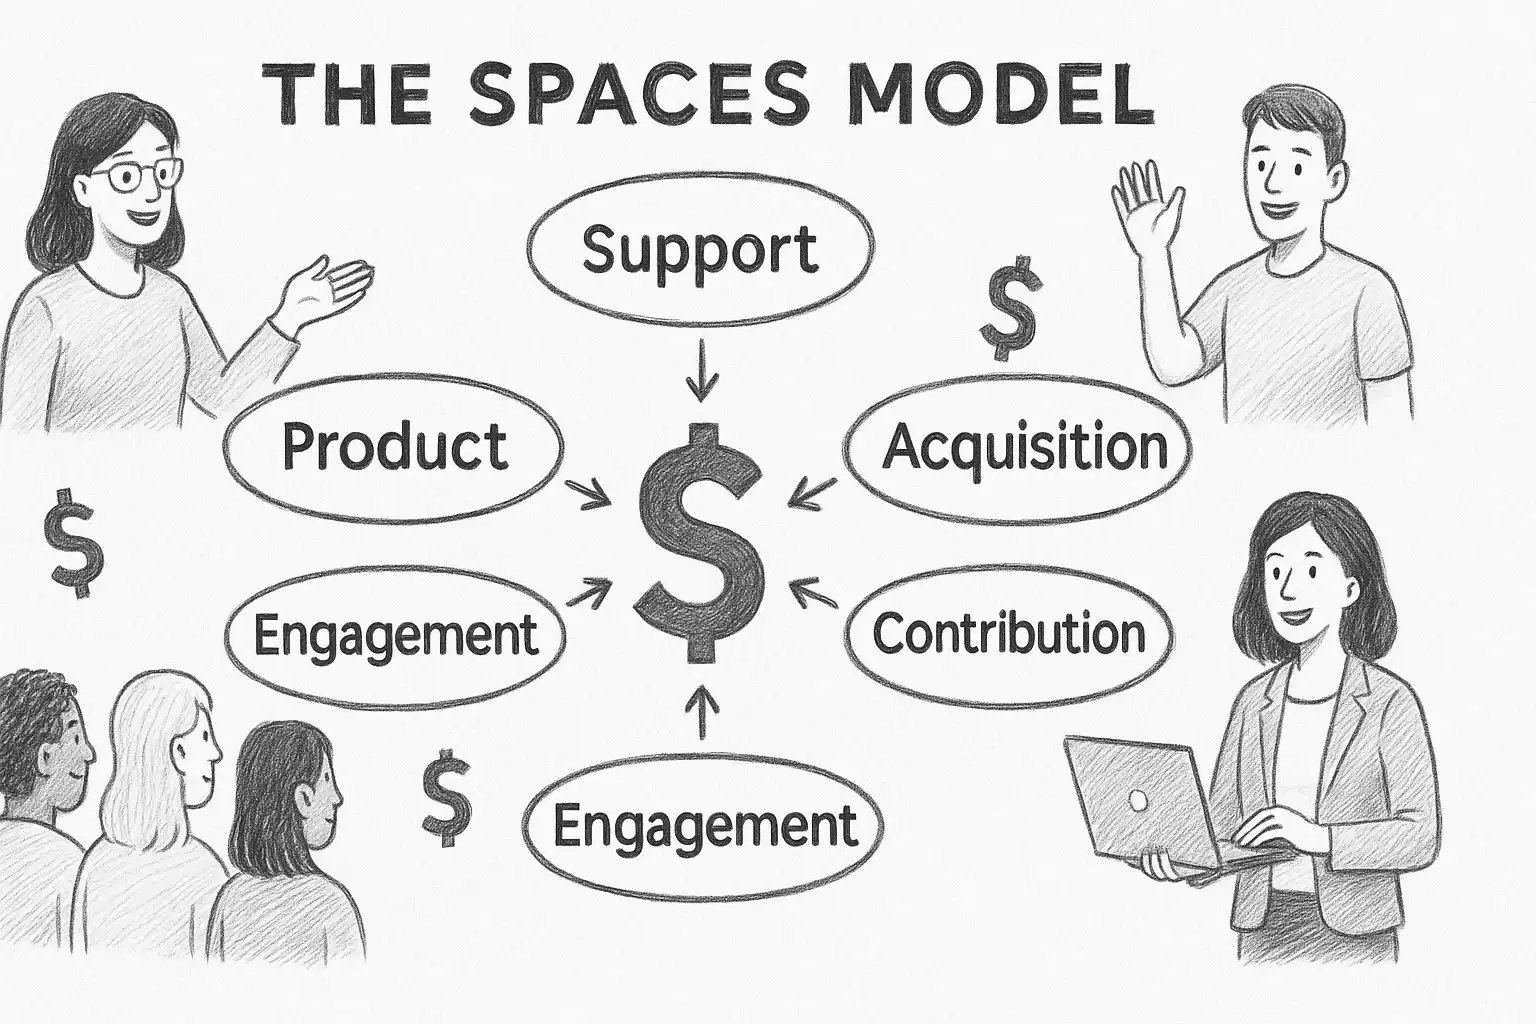
SPACES breaks community impact into six business outcomes:
Support
Product
Acquisition
Contribution
Engagement
Success
Choose one primary and one secondary outcome for the next quarter.
Track two or three laser‑focused KPIs for each; convert wins to dollars.
A monthly, one‑page Community P&L keeps leadership hooked.
Benchmarks show peer answers can save $2 million a month and daily‑use ratios of 30 % + drive stickiness.
1. The Credibility Gap
Ask any community manager why their forum matters and you will hear stories about helpful members, viral threads and “warm fuzzies”.
Then, ask your CFO the same question and you will get a polite nod - and a frozen budget.
That gap is killing community programs. Bevy’s State of the Community Industry 2024 report found only 42% of the teams connect community metrics to a CRM. Without hard numbers, execs see community as a cost center. (Read - Online community cost)
The SPACES model solves this by linking every action - answering a question, posting feedback, sharing a success story - to a line item the finance team already understands.
2. SPACES + Community Value in Plain English
**Outcome**       | **What it Does**                          | **Dollar Lever**
------------------|-------------------------------------------|----------------------
Support           | Peer answers reduce support tickets       | Cost savings
Product           | User feedback guides the roadmap          | Faster revenue
Acquisition       | Prospects join, then buy                  | New revenue
Contribution      | Members create extensions, docs           | Ecosystem growth
Engagement        | Habit fosters retention                   | Lifetime value
Success           | Education cuts churn                      | Revenue protection
You don’t have to chase all six at once. In fact, you shouldn’t.
3. Six Outcomes, Fresh Benchmarks
The beauty of the SPACES model lies in how clearly each outcome ties back to real business value. But to make it more practical - and defensible during budget conversations- you need benchmarks that ground your strategy in reality.
Let’s break each one down with data-driven proof points that make your leadership team lean in.
Support: Deflect Tickets, Bank Savings
Support communities often deliver immediate ROI. Salesforce’s Trailblazer Community is a perfect example. When they measured impact, they found that each ticket deflected saved around $50. Multiply that across thousands of interactions, and the savings added up fast—over $2 million per month, just from community-powered peer support.
If you're managing a support-driven community, aim for a 25%+ ticket deflection rate and a time-to-answer under four hours. These aren’t vanity metrics—they directly reduce support workload and cost.
Product: Build What Users Always Want
Jatra works with several SaaS communities, and we’ve consistently seen how engaged beta testers improve product cycles. Across 12 clients, beta testers helped identify bugs early - cutting QA time by 15 to 20% on average.
That translates into faster releases and fewer post-launch issues. A tight feedback loop with your users doesn’t just make your product better - it accelerates your revenue pipeline.
Acquisition: Turn Lurkers into Leads
Community isn't just for retention - it can drive growth. Community-led growth is game-changing. According to Talkbase, 5–7% of anonymous community visitors (aka lurkers) end up converting into free trial sign-ups in high-performing SaaS communities.
Track two key KPIs here:
Community-sourced qualified leads
Lead-to-sale conversion rate
These numbers help you speak the same language as your marketing and sales teams.
Contribution: Let Users Extend Your Product
WordPress is the poster child of community-powered contribution. With over 59,000 volunteer plugin developers, they’ve built an ecosystem competitors can’t touch.
You don’t need tens of thousands of contributors to see value. Even a few active members creating documentation, integrations, or templates can shift the workload off your team - and make your product more valuable to others.
Measure add-on downloads, docs written, and referral revenue; not just number of posts.
Engagement: Keep Them Coming Back
Want your product to stick? Get users into a habit loop. Duolingo offers the perfect case study here: in 2024, they clocked 34.1 million daily active users out of 103.6 million monthly users- 33% DAU/MAU ratio.
This level of engagement is what drives retention and long-term ARR. Aim for a DAU/MAU ratio of 30% or higher to ensure your community isn’t just growing -it's thriving.
Success: Teach Them to Win
When your members succeed, they stay. The Community Roundtable reported that companies who embedded learning and certification programs inside their communities saw churn reductions of 15–30% within a year.
It’s not just support or training - it’s onboarding, activation, and retention, all wrapped into one. Your community becomes an engine for customer success.
4. Visual Chat-Sheets for Quick Wins
Not every decision-maker wants to read a wall of text; and honestly, neither do most readers. That’s why turning key insights into visual assets is a smart way to boost clarity and SEO.
Here are two ready-to-drop that images that bring the SPACES model to life:
KPI Matrix: SPACES Targets at a Glance
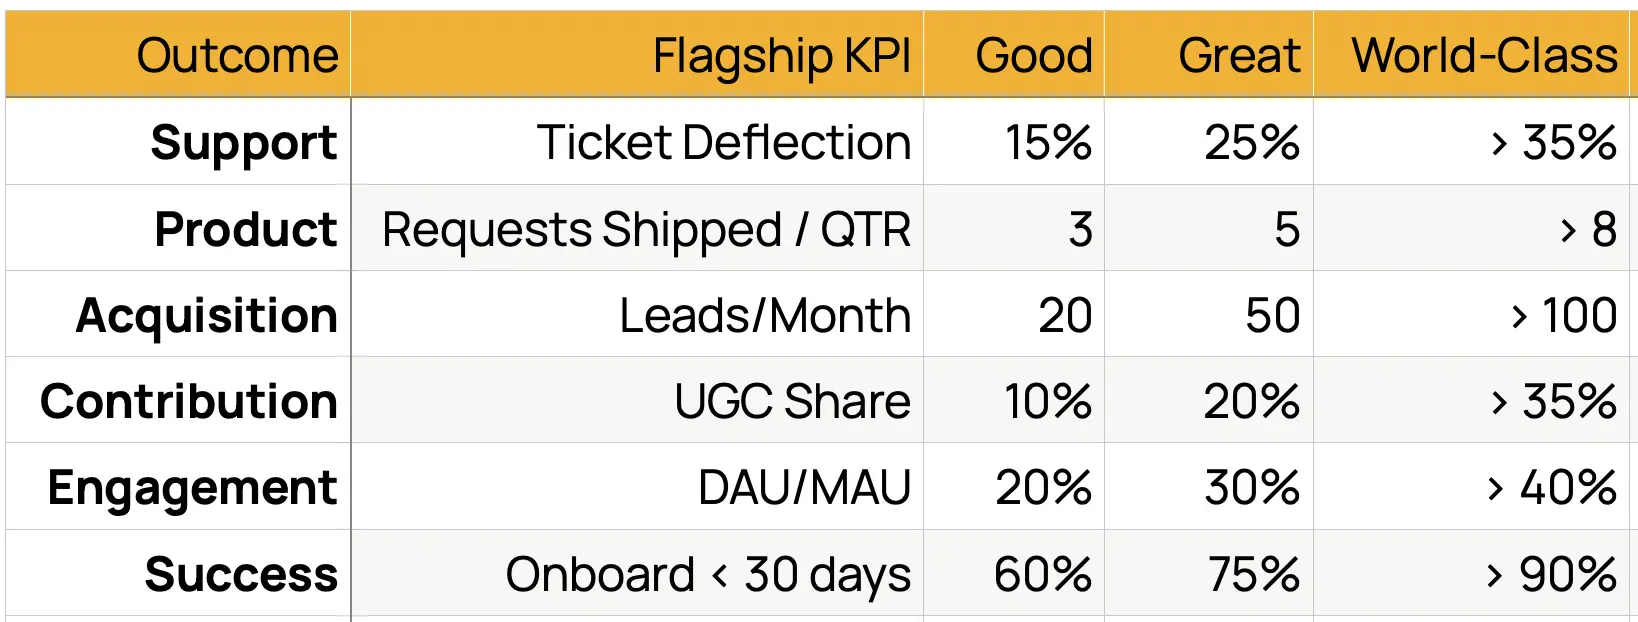 Perfect for pitch decks, monthly updates or internal team dashbaords.
SPACES Radar Template: Score Your Focus
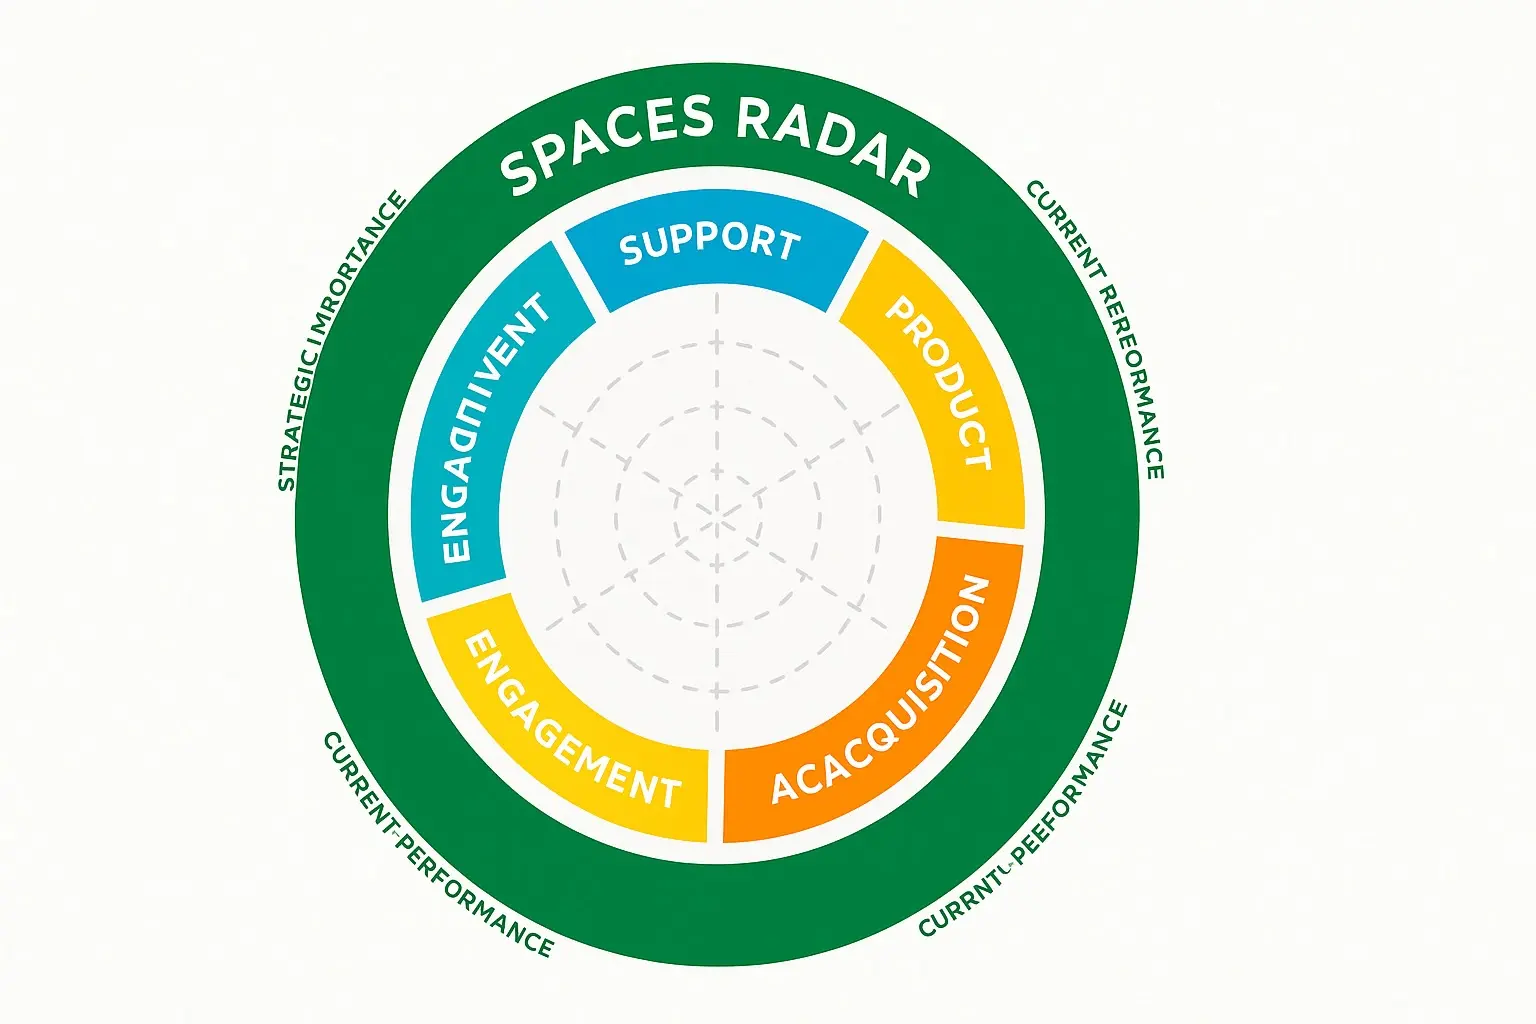 This blank radar chart helps you visually map your current strengths and weaknesses across all six SPACES outcomes. Great for team workshops, QBRs, or leadership planning.
5. Choose Your Focus:The Radar Gap Test
Now that you understand all six outcomes, here’s the reality: you can’t do everything at once.
The smart play? Zoom in on the one outcome where there’s the biggest opportunity for impact.
Here’s how to do it:
Score each SPACES slice from 0 to 5 for Strategic Importance
(Ask: how critical is this to our business goals right now?)Then score each one from 0 to 5 for Current Performance
(Ask: how well are we doing here today?)Subtract performance from importance to calculate the “gap.”
The slice with the biggest gap becomes your primary outcome.The next-biggest gap? That’s your secondary focus for the quarter.
Everything else? Put it on pause. This gap-first method ensures your energy and resources go where they’ll make the most difference. You’ll avoid spreading yourself thin, and you’ll actually move the needle - fast!
Pro tip: revisit your radar chart every quarter. New goals = new gaps = new focus.
6. The 90-Day Rollout Plan
Once you've locked in your primary and secondary SPACES outcomes, it's time to take focused action. A good community strategy isn't just about big ideas - it’s about what gets done in 90 days. Here's a battle-tested plan you can plug right into your next quarterly roadmap.
Week 1
Start by auditing your existing community metrics. Identify what you're already tracking, what tools you're using, and which outcomes those metrics map to in the SPACES model. This gives you a clear baseline across Support, Product, Acquisition, Contribution, Engagement, and Success.
Week 2
Now, choose your flagship KPIs - ideally one for your primary outcome and one for your secondary.
For example, if your focus is on Support and Product, you might pick “ticket deflection rate” and “number of feature requests implemented” as your core metrics.
Week 3
Run a quick-win experiment focused on your primary outcome. This could be as simple as adding a “Best Answer” badge to your forum, launching a “Roadmap Voting” thread, or starting a featured contributor series. The goal here isn’t perfection - it’s movement.
Weeks 4 to 8
During these four weeks, track your KPIs bi-weekly. Share small wins with your team and document what’s working. This middle stretch is all about testing, learning, and adjusting quickly.
Week 9
With real data in hand, it’s time to build your first Community P&L dashboard. This could be a single slide per outcome with key metrics, a short summary of impact, and one line that translates it into dollars saved or earned. Make it visual. Keep it tight.
Weeks 10 to 12
Wrap the quarter by rolling out something more meaningful for your secondary outcome. This could be a new mentorship program, a lightweight gamification layer, or a user-generated content push (like member-authored guides). These efforts deepen engagement and round out your impact.
7. What is a Community P&L - and Why You Need One
Your community needs more than just excitement and emojis to stay funded - it needs a story that your leadership can understand in one glance. That’s where the Community P&L (Profit & Loss) comes in.
Think of it as your monthly or quarterly scoreboard. It’s not just for bragging rights - it’s for making strategic asks and proving ROI without needing a 40-slide deck.
Here’s what to include:
Each SPACES outcome you focused on (start with 1–2).
Flagship KPI for each (e.g., ticket deflection, DAU/MAU, new leads).
A short explanation of what moved the needle and why.
Dollar impact (e.g., 150 tickets deflected × $50 = $7,500 saved).
One highlight quote or member win per section (this humanizes your numbers).
Wrap it up with one strong ask: a feature, a budget boost, or support from another team. When done right, this becomes the most important slide in your QBR.
✍️ Tip: Keep it to 1–3 slides max. Add visuals like sparklines or emojis if you're sending it over Slack or email.
8. Pitfalls to Avoid (And How to Fix Them)
Even the best community plans can fizzle out if you fall into these traps. The good news? Each one has a simple fix.
❌ Trying to do everything at once
🛠️ Fix: Stick to one primary and one secondary outcome. You’ll move faster and build momentum.
❌ Reporting vanity metrics (likes, member count, etc.)
🛠️ Fix: Always tie your metrics to either dollars saved, revenue influenced, or churn reduced.
❌ No cross-functional support
🛠️ Fix: Host a monthly “SPACES Sync” with Product, Support, Marketing, and Success teams. Keep it informal, but consistent.
❌ Hiding wins inside dashboards
🛠️ Fix: Record a 30-second Loom walkthrough of a success metric. Share it in your leadership Slack channel with a short caption.
❌ Using metrics without a story
🛠️ Fix: Add one quote, one screenshot, or one real example to bring each KPI to life.
The magic lies in telling a story that connects metrics to people and progress.
Final Words: From Community Chatter to Business Clout
Your community is not just a vibe - it’s a lever. The SPACES model gives you the language, structure, and metrics to show real business value.
So don’t wait for permission. Pick your outcomes. Set your KPIs. Share your wins. And when the next budget cycle rolls around, you’ll already have the data (and the story) that proves why your community matters.